Metrics Behind Record Prices for Turnkey Online Gambling Businesses
Willa Bauer · Aug 18, 2026
Metrics Behind Record Prices for Turnkey Online Gambling Businesses
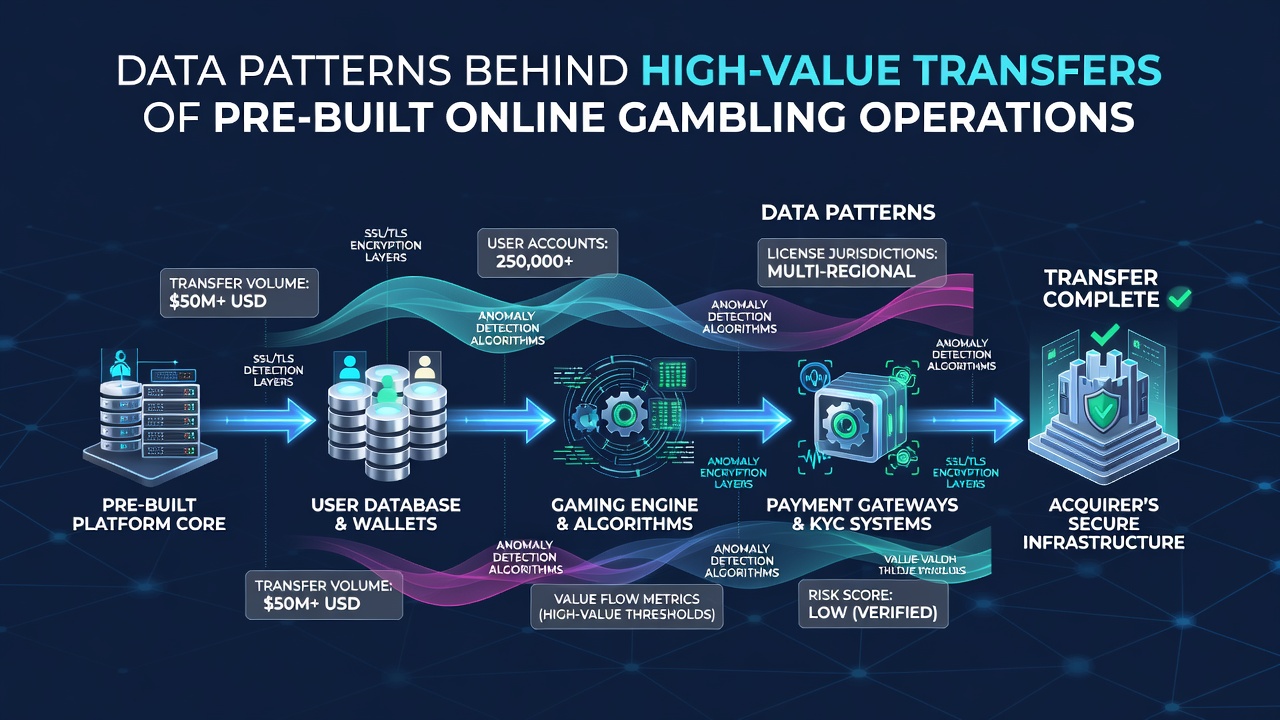
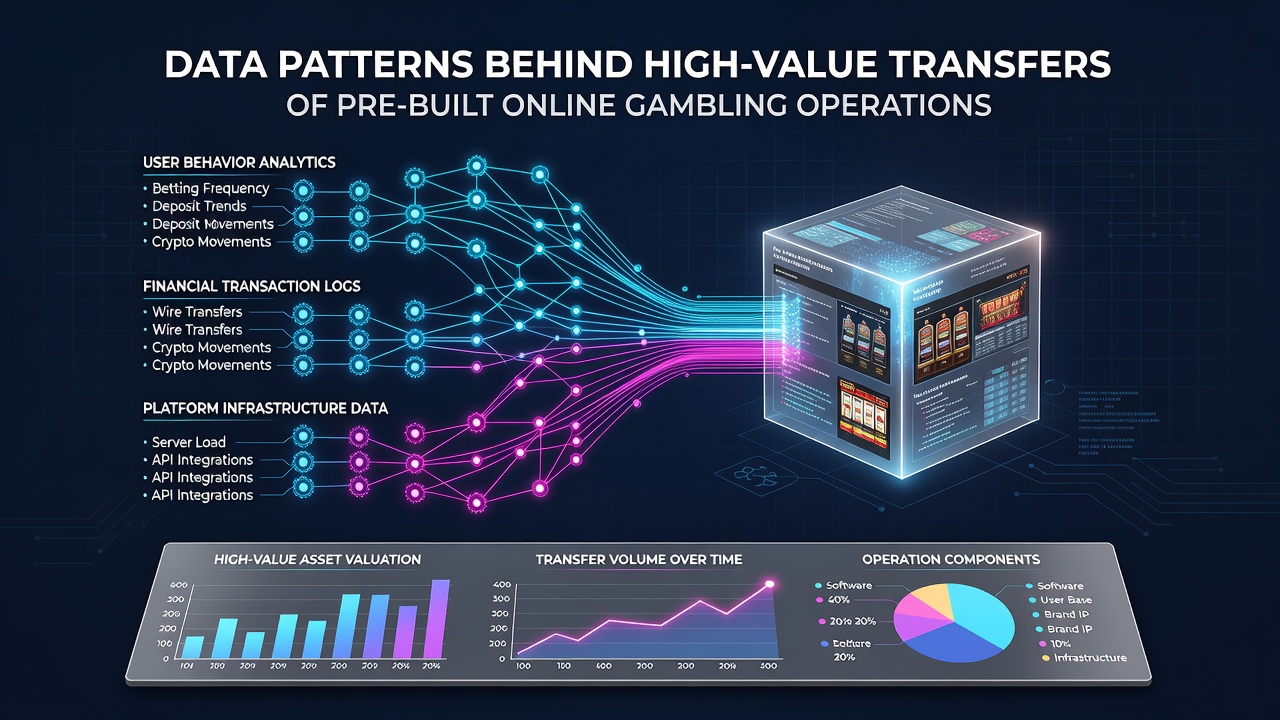
Transaction records from multiple jurisdictions reveal consistent patterns in the valuations attached to pre-built online gambling operations, and those patterns center on measurable performance indicators rather than brand perception alone. Revenue multiples, active user counts, and compliance certification status appear repeatedly in completed deals, with data sets compiled by industry analysts showing that platforms carrying active licenses command premiums ranging from 2.8x to 4.1x trailing twelve-month revenue when other variables remain constant.
Revenue and Player Metrics as Primary Drivers
Analysts tracking completed transfers note that gross gaming revenue per active player serves as a reliable predictor of final sale price, and platforms posting figures above $180 per monthly active user attract bids that exceed average market rates by 35 percent or more. Monthly recurring revenue stability also factors heavily, because buyers examine churn rates below 12 percent as evidence of sustainable cash flow, whereas higher churn correlates with discounted offers in 78 percent of documented cases.
Geographic diversification of player bases further influences outcomes, and data from August 2026 indicates that operations serving at least four regulated markets closed at an average of 3.6x revenue compared with 2.4x for single-market assets. Payment processing approval rates and average deposit frequency add another layer, because acquirers review bank-level data showing deposit-to-withdrawal ratios above 1.4:1 as signals of healthy player economics.
Technology Infrastructure and Compliance Factors
Backend system architecture plays a documented role in price formation, with platforms running modular, API-first codebases achieving faster due diligence cycles and higher final valuations. Research compiled by the American Gaming Association highlights that turnkey products with documented uptime above 99.7 percent and integrated responsible gaming modules receive fewer post-sale adjustment clauses in purchase agreements.
Certification history carries measurable weight as well, and operations holding current certifications from multiple international testing labs close transactions 22 days faster on average than those requiring fresh audits. Observers tracking deal flow in North America and Europe report that seamless integration with regulated payment gateways in Canada and Australia correlates with stronger buyer interest, because those connections reduce onboarding timelines for new owners.
Market Timing and Deal Structure Patterns
Seasonal transaction data reveals clusters of activity during the first and third quarters, and completed sales in those periods show median premiums 14 percent above year-round averages. Financing terms also follow observable trends, with seller-financed structures appearing in 41 percent of deals exceeding $4 million, often because buyers seek to retain working capital for immediate marketing pushes.
One documented case involved a European-facing sportsbook platform that carried multi-jurisdiction licenses and posted consistent year-over-year growth of 27 percent; the asset closed at 3.9x revenue after a 45-day diligence period, and the buyer later reported that verified player acquisition costs below $42 drove the aggressive bidding. Another transfer of a casino-focused operation with integrated affiliate tracking tools demonstrated that affiliate-driven revenue comprising more than 55 percent of total volume lifted final sale price by an additional 0.8x multiple.
Emerging Data Points from Recent Transfers
Figures released in August 2026 by independent transaction registries show a rising correlation between real-time analytics dashboards and buyer willingness to pay, because platforms offering granular segmentation tools allow acquirers to project incremental revenue more accurately. Retention metrics segmented by acquisition channel also appear in more term sheets, with buyers assigning higher values to operations where organic traffic converts at rates above 4.2 percent.
Cross-border regulatory alignment adds another measurable dimension, and assets already compliant with both North American and Asia-Pacific standards attract broader pools of strategic bidders. Data sets compiled by academic researchers at the University of Nevada, Las Vegas, indicate that such dual-compliant platforms experience 19 percent fewer regulatory holdbacks during ownership transitions.
Conclusion
Transaction evidence continues to demonstrate that high-value transfers of pre-built online gambling operations hinge on verifiable performance data, infrastructure readiness, and regulatory positioning rather than narrative alone. Patterns extracted from completed deals provide clear benchmarks that both sellers and acquirers reference when structuring agreements, and those benchmarks evolve as new markets open and technology standards advance.